Where a TMS clinic is within reach, and where it isn’t.
Directory snapshot taken October 26, 2026. Every figure on this page is computed from that snapshot; see the methodology.
- Finding 1 0.44 per 100,000
1,498 confirmed TMS sites serve 340 million people.
That is one site for every 227,043 residents of the 50 states and DC. A site counts as confirmed when its listing names a TMS device or has TMS in the practice name.
- Finding 2 7× state gap
Delaware and Nevada have about 7 times as many sites per resident as Mississippi.
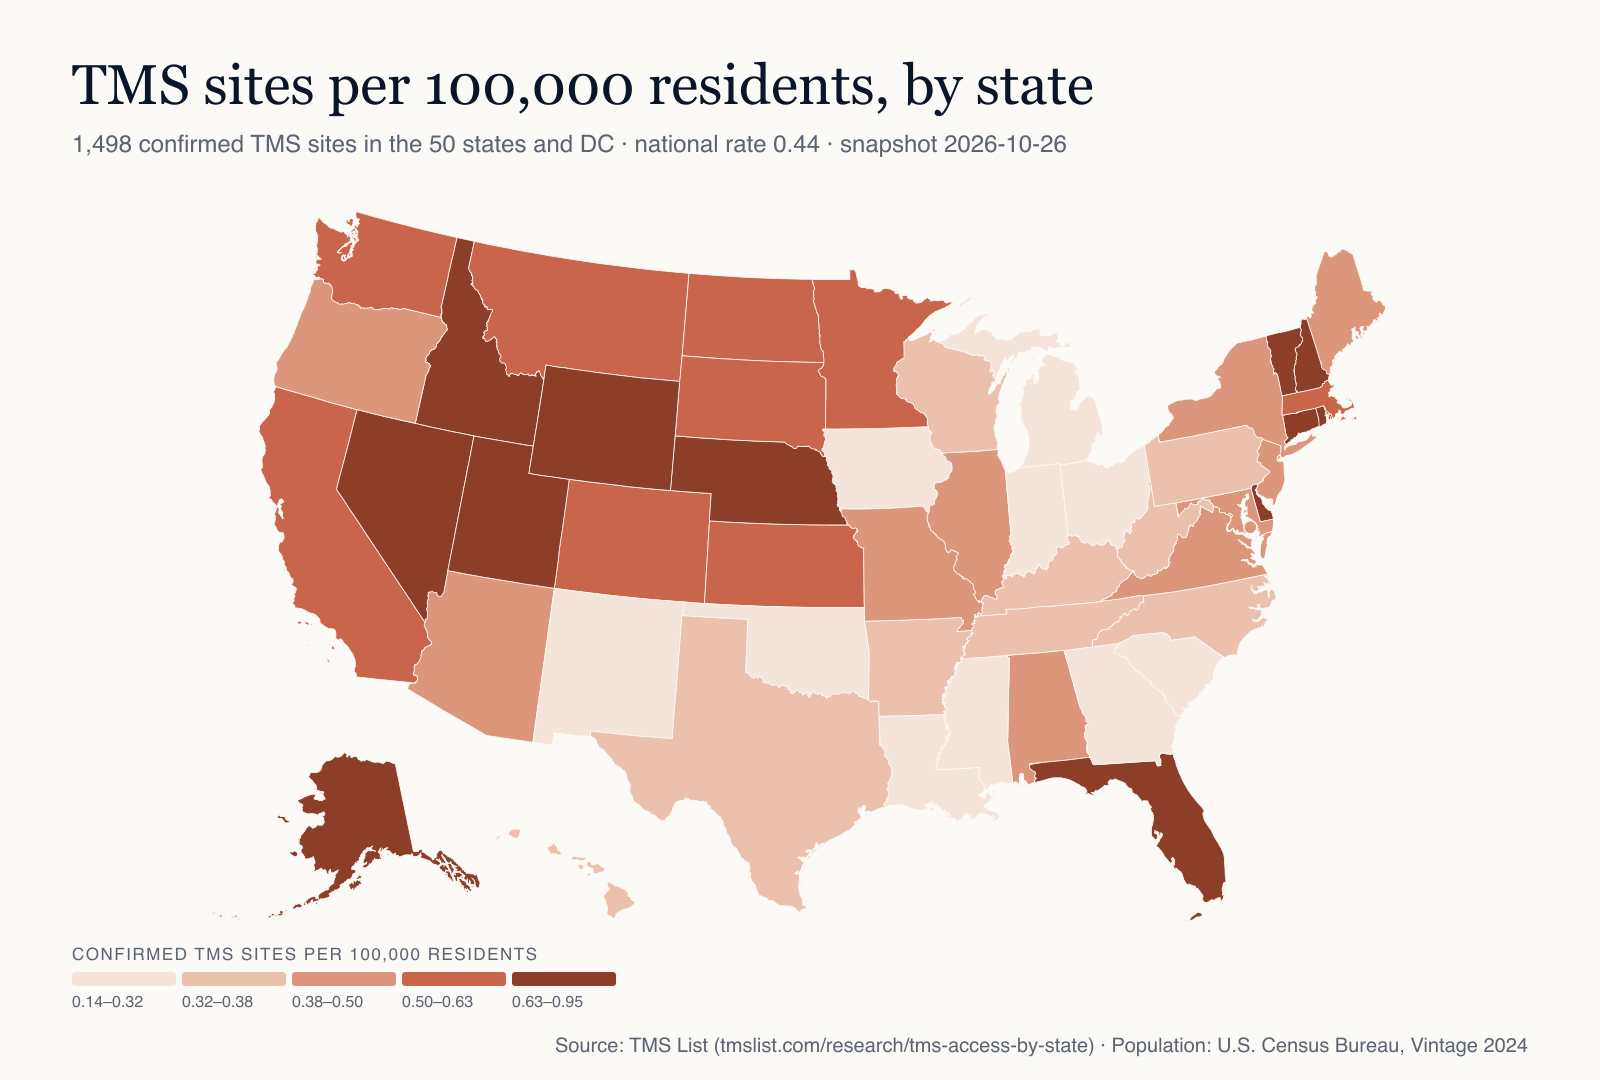
Delaware (0.95), Nevada (0.95), Vermont (0.93) lead on sites per 100,000 residents. Mississippi (0.14), Michigan (0.18), Indiana (0.20) trail. Small numbers drive some of these rates, so one opening or closure moves them: Delaware has 10 sites, Vermont has 6 sites, Wyoming has 5 sites, Mississippi has 4 sites, Indiana has 14 sites.
- Finding 3 0.32 Texas, per 100k
The four most populous states sit far apart.
California: 199 sites, 0.50 per 100,000 (rank 20 of 51). Texas: 101 sites, 0.32 per 100,000 (rank 40 of 51). Florida: 165 sites, 0.71 per 100,000 (rank 8 of 51). New York: 94 sites, 0.47 per 100,000 (rank 23 of 51).
- Finding 4 57% name NeuroStar
NeuroStar and BrainsWay account for almost every named TMS device.
1,028 of the 1,498 confirmed sites name a device brand. Of those, 57% list NeuroStar and 43.6% list BrainsWay deep TMS. 1.3% list MagVenture, and 2% list both NeuroStar and BrainsWay.
- Finding 5 4 of 1,498 show a price
Prices are almost never published, and insurance lists rarely.
Only 4 confirmed sites publish a per-session or full-course price, too few to report any price statistic. 79 (5.3%) publish which insurers they accept; 87.3% of those name Medicare. Of 516 sites that post opening hours, 10.7% list Saturday or Sunday hours.
Confirmed TMS sites per 100,000 residents
Darker states have more sites for their population. Select a state to see its clinics.
- 0.14–0.32
- 0.32–0.38
- 0.38–0.50
- 0.50–0.63
- 0.63–0.95
Five groups of about ten states each (quintiles). Source: TMS List directory, October 26, 2026; U.S. Census Bureau, Vintage 2024.
The full state table
Sort by any column. Each state links to its clinic directory.
| 1 | Delaware | 10 | 0.95 | 105,192 | 24 | 6 | — | — | 1,051,917 |
| 2 | Nevada | 31 | 0.95 | 105,402 | 41 | 7 | 63.6% | 36.4% | 3,267,467 |
| 3 | Vermont | 6 | 0.93 | 108,082 | 18 | 6 | — | — | 648,493 |
| 4 | Wyoming | 5 | 0.85 | 117,524 | 7 | 4 | — | — | 587,618 |
| 5 | Idaho | 17 | 0.85 | 117,742 | 42 | 12 | 62.5% | 37.5% | 2,001,619 |
| 6 | Alaska | 6 | 0.81 | 123,356 | 6 | 3 | — | — | 740,133 |
| 7 | Utah | 25 | 0.71 | 140,145 | 39 | 20 | 77.8% | 16.7% | 3,503,613 |
| 8 | Florida | 165 | 0.71 | 141,650 | 277 | 80 | 52.5% | 50% | 23,372,215 |
| 9 | Nebraska | 14 | 0.70 | 143,248 | 21 | 7 | 91.7% | 16.7% | 2,005,465 |
| 10 | New Hampshire | 9 | 0.64 | 156,559 | 23 | 7 | — | — | 1,409,032 |
| 11 | Rhode Island | 7 | 0.63 | 158,901 | 16 | 2 | — | — | 1,112,308 |
| 12 | Connecticut | 23 | 0.63 | 159,786 | 56 | 17 | 42.9% | 57.1% | 3,675,069 |
| 13 | Colorado | 37 | 0.62 | 161,013 | 47 | 24 | 26.1% | 69.6% | 5,957,493 |
| 14 | Massachusetts | 44 | 0.62 | 162,186 | 88 | 37 | 67.6% | 32.4% | 7,136,171 |
| 15 | Kansas | 18 | 0.61 | 165,034 | 38 | 8 | 28.6% | 71.4% | 2,970,606 |
| 16 | Washington | 44 | 0.55 | 180,868 | 52 | 27 | 68.8% | 31.3% | 7,958,180 |
| 17 | South Dakota | 5 | 0.54 | 184,934 | 28 | 4 | — | — | 924,669 |
| 18 | Montana | 6 | 0.53 | 189,539 | 31 | 5 | — | — | 1,137,233 |
| 19 | Minnesota | 30 | 0.52 | 193,105 | 53 | 25 | 74.1% | 25.9% | 5,793,151 |
| 20 | California | 199 | 0.50 | 198,147 | 266 | 104 | 53.5% | 44.2% | 39,431,263 |
| 21 | North Dakota | 4 | 0.50 | 199,142 | 7 | 2 | — | — | 796,568 |
| 22 | Arizona | 36 | 0.47 | 210,622 | 62 | 13 | 50% | 54.5% | 7,582,384 |
| 23 | New York | 94 | 0.47 | 211,354 | 249 | 55 | 40.7% | 61% | 19,867,248 |
| 24 | Alabama | 24 | 0.47 | 214,904 | 49 | 17 | 64.7% | 35.3% | 5,157,699 |
| 25 | Illinois | 59 | 0.46 | 215,426 | 104 | 44 | 41.7% | 56.3% | 12,710,158 |
| 26 | New Jersey | 43 | 0.45 | 220,950 | 97 | 37 | 33.3% | 66.7% | 9,500,851 |
| 27 | Oregon | 19 | 0.44 | 224,862 | 41 | 13 | 30% | 70% | 4,272,371 |
| 28 | District of Columbia | 3 | 0.43 | 234,083 | 5 | 2 | — | — | 702,250 |
| 29 | Maine | 6 | 0.43 | 234,169 | 29 | 3 | — | — | 1,405,012 |
| 30 | Virginia | 37 | 0.42 | 238,140 | 90 | 22 | 76.7% | 20% | 8,811,195 |
| 31 | Missouri | 24 | 0.38 | 260,228 | 35 | 17 | 46.7% | 53.3% | 6,245,466 |
| 32 | Maryland | 24 | 0.38 | 260,968 | 63 | 21 | 52.9% | 52.9% | 6,263,220 |
| 33 | Pennsylvania | 49 | 0.37 | 266,913 | 179 | 37 | 47.4% | 52.6% | 13,078,751 |
| 34 | Kentucky | 17 | 0.37 | 269,904 | 42 | 9 | 78.6% | 21.4% | 4,588,372 |
| 35 | Arkansas | 11 | 0.36 | 280,759 | 28 | 9 | — | — | 3,088,354 |
| 36 | North Carolina | 39 | 0.35 | 283,231 | 68 | 21 | 62.5% | 37.5% | 11,046,024 |
| 37 | Tennessee | 25 | 0.35 | 289,110 | 49 | 15 | 76.2% | 28.6% | 7,227,750 |
| 38 | Hawaii | 5 | 0.35 | 289,229 | 9 | 4 | — | — | 1,446,146 |
| 39 | West Virginia | 6 | 0.34 | 294,997 | 35 | 5 | — | — | 1,769,979 |
| 40 | Texas | 101 | 0.32 | 309,810 | 128 | 53 | 45.6% | 52.9% | 31,290,831 |
| 41 | Wisconsin | 19 | 0.32 | 313,736 | 85 | 14 | 75% | 25% | 5,960,975 |
| 42 | Georgia | 35 | 0.31 | 319,454 | 64 | 29 | 75% | 31.3% | 11,180,878 |
| 43 | New Mexico | 6 | 0.28 | 355,043 | 16 | 4 | — | — | 2,130,256 |
| 44 | Iowa | 9 | 0.28 | 360,165 | 53 | 7 | — | — | 3,241,488 |
| 45 | Ohio | 32 | 0.27 | 371,353 | 72 | 26 | 60.7% | 42.9% | 11,883,304 |
| 46 | Louisiana | 12 | 0.26 | 383,145 | 60 | 7 | — | — | 4,597,740 |
| 47 | Oklahoma | 10 | 0.24 | 409,539 | 29 | 6 | — | — | 4,095,393 |
| 48 | South Carolina | 12 | 0.22 | 456,569 | 23 | 8 | 70% | 40% | 5,478,831 |
| 49 | Indiana | 14 | 0.20 | 494,591 | 76 | 9 | 50% | 50% | 6,924,275 |
| 50 | Michigan | 18 | 0.18 | 563,359 | 150 | 16 | 60% | 40% | 10,140,459 |
| 51 | Mississippi | 4 | 0.14 | 735,761 | 26 | 3 | — | — | 2,943,045 |
| United States | 1,498 | 0.44 | 227,043 | 3,196 | 933 | 57% | 43.6% | 340,110,988 |
* Share of sites that name a device brand; shown when at least 10 sites in the state do. “All listings” adds psychiatry and mental-health practices whose listing does not show TMS. Rank is by sites per 100k.
Coverage of each field, nationally
How many of the 1,498 confirmed sites publish each detail on their listing. A low number means patients have to call to find out.
With 4 priced sites, the directory cannot say what TMS costs by state. For typical price ranges and how insurance coverage works, see our TMS cost guide and insurance guides.
How we built this
What we counted
Every listing in the TMS List clinic directory located in the 50 states or the District of Columbia, as the directory stood on October 26, 2026. Each location of a multi-site practice is its own listing. The headline measure counts confirmed TMS sites: listings that name a TMS device, or that have TMS (or transcranial magnetic stimulation) in the practice name. That is 1,498 of the 3,196 listings (46.9%).
The other 1,698 listings are psychiatry and mental-health practices whose listing shows neither signal. Many of them do offer TMS, so the “All listings” column and CSV field report them too, at 0.94 per 100,000 nationally. Treat the confirmed count as a floor and all listings as a ceiling.
Exclusions
Of 4,127 US listings in the directory file, 786 were taken down after a review found they are not TMS providers (physical therapy, primary care and similar practices whose websites do not mention TMS). Practices that asked to be removed from the directory are not counted either. 9 listings located outside the 50 states and DC (Puerto Rico, and a few with addresses abroad) are left out. A further 136 listings with no TMS device and no psychiatry or mental-health signal in their name or business categories are excluded. 3,196 listings remain.
Population
Resident population on July 1, 2024 from the U.S. Census Bureau, Population Division, Vintage 2024 estimates (NST-EST2024, column POPESTIMATE2024; census.gov, data file). The 51 values sum to the published US total of 340,110,988. Rates use the whole population, not only adults or people with depression.
Definitions
Sites per 100k: confirmed sites ÷ population × 100,000. Device brand: the listing’s device field names NeuroStar, BrainsWay (including “Deep TMS”), MagVenture or another manufacturer; generic entries such as “FDA-cleared TMS” do not count. Device percentages are shares of sites that name a brand, and a site can name more than one. Insurance: the listing names at least one accepted insurer. Price: the listing gives a dollar figure per session or per course. Weekend hours: posted office hours include a Saturday or Sunday time range; listings showing “Open 24 hours” (facility hours, mostly hospitals) are left out of that measure.
Minimum samples
State percentages are shown only when at least 10 sites are in the base; smaller states show “—”. Price statistics need at least 5 priced sites at any level. With 4 nationally, none are reported.
Limitations
A listing is a location, not capacity: it says nothing about how many chairs, clinicians or appointment slots a site has. The directory is compiled from public sources (device-maker clinic locators, public business profiles, provider registries) and from clinic submissions. It misses sites that appear in none of these, and not every listing has been checked by our team. Device names come largely from manufacturer locators, which favours the brands that publish one. Small states have few sites, so one opening or closure moves their rate a lot. Hospitals and health systems offering TMS inside a larger department may be undercounted.
Updates and corrections
This is the 2026 edition, frozen at the October 26, 2026 snapshot so the figures stay citable. Directory pages update continuously and may show different counts. Clinics can correct their listing through the provider portal; spotted an error in the study? Contact us.
Free to use, with a link.
The data is published under CC BY 4.0. Journalists, researchers and health organisations can reuse it, including the map, if they credit TMS List and link to this page.
TMS List. (2026). TMS Access by State (2026): Clinics per Capita, Devices, Insurance and Price Transparency [Data set]. https://tmslist.com/research/tms-access-by-state/
<a href="https://tmslist.com/research/tms-access-by-state/"><img src="https://tmslist.com/images/research/tms-access-by-state-2026-map.png" alt="Map: confirmed TMS sites per 100,000 residents by US state (TMS List, 2026)" width="800" height="540" loading="lazy"></a><br><small>Source: <a href="https://tmslist.com/research/tms-access-by-state/">TMS List, TMS access by state</a></small>